
SRE Multi-Agent Platform - Powered by Google ADK
Production-grade Site Reliability Engineering (SRE) using a multi-agent AI architecture. Engineered with Google Agent Development Kit (ADK), deployed on GCP, with full observability via Cloud Trace, Langfuse, LangSmith, Prometheus, and Grafana.
Executive Summary
Modern SRE is traditionally reactive — humans get paged, scramble to find dashboards, and manually triage alerts. This platform demonstrates a paradigm shift: AI agents performing the heavy lifting of infrastructure management and incident response.
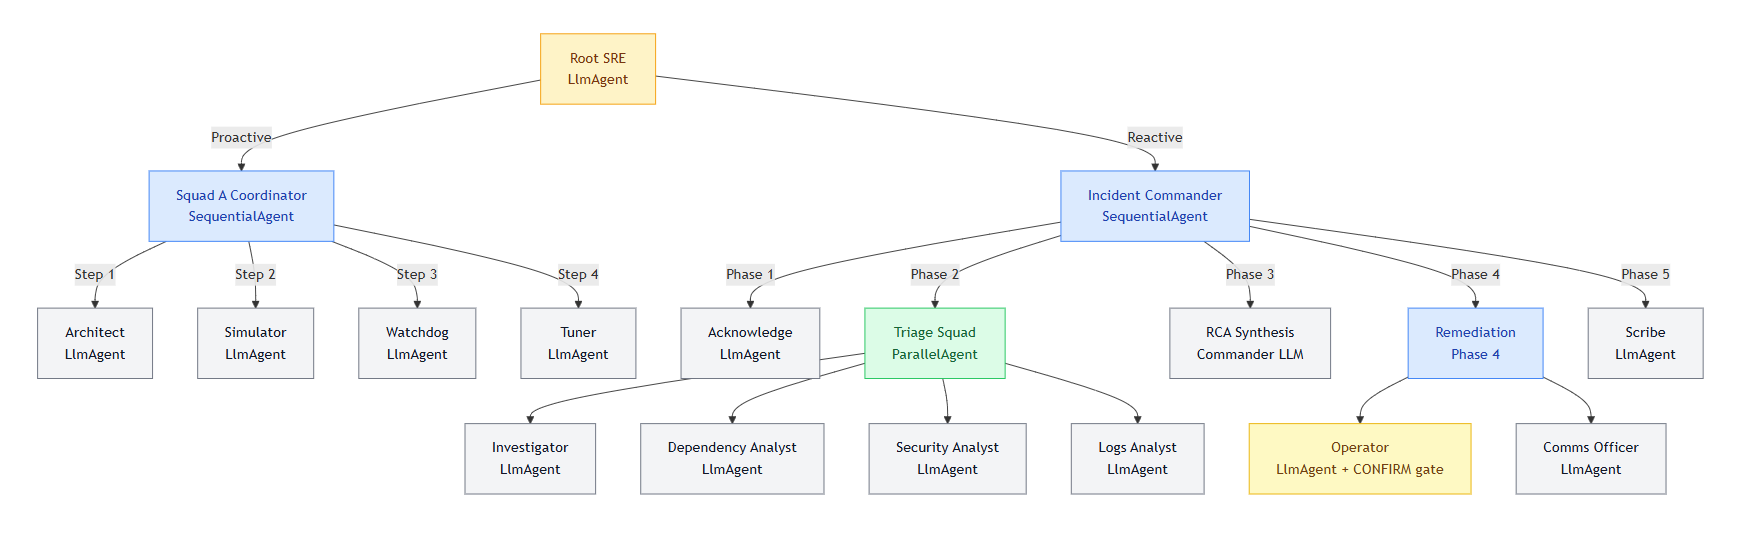
- 15 distinct AI agents across 2 specialized squads — Squad A (Proactive Platform Engineers) and Squad B (Reactive SRE Responders), orchestrated by a central routing agent
- Service Onboarding (Day 0/1): Auto-generates architecture blueprints, SLO recommendations, and monitoring configurations
- Platform Health (Day 2+): Proactively monitors infrastructure, API quotas, and metric ingestion pipelines
- P1 Incident Response: Executes a 5-phase sequential pipeline activating 9 agents — from parallel triage to remediation, communications, and automated postmortem generation
- Enterprise Observability: Every agent action is traced, logged, and scored — full span hierarchies (tool latency, token counts, agent delegation chains) visible in Cloud Trace and Langfuse
Table of Contents
- Architecture Overview
- Agent Design
- Infrastructure Stack
- Observability Stack
- Agent Evaluation Framework
- Observability Tool Comparison
- Deployment Architecture
- Conceptual Repository Structure
- Roadmap
- Consulting & Implementation
Architecture Overview
End-to-End System Data Flow
┌──────────────────────────────────────────────────────────────────────────────────┐
│                          GCP INFRASTRUCTURE LAYER                                │
│                                                                                  │
│ Target Services                 Observability Backend                            │
│ ┌───────────────────┐           ┌────────────────────────────────┐               │
│ │ App Containers    │──scrape──>│ Prometheus                     │               │
│ │ /metrics endpoint │           │ Grafana                        │               │
│ └───────────────────┘           │ Alertmanager                   │               │
│                                 └──────────────┬─────────────────┘               │
│                                                │ alert fired (SLO breach)        │
│ Serverless Tooling                             v                                 │
│ ┌────────────────────────┐      ┌──────────────────────────┐                     │
│ │ Cloud Functions        │      │ Pub/Sub Event Bus        │                     │
│ │ (Prometheus, Logs, etc)│      └──────────────┬───────────┘                     │
│ └──────────┬─────────────┘                     │                                 │
│            │ HTTP calls from agents            │ triggers                        │
│            v                                   v                                 │
│ ┌────────────────────────────────────────────────────────────────────────┐       │
│ │                    AGENT ORCHESTRATION LAYER                           │       │
│ │                                                                        │       │
│ │         ┌────────────────────────────────────┐                         │       │
│ │         │      SRE Platform Agent (root)     │                         │       │
│ │         │   Classifies intent -> routes to   │                         │       │
│ │         │   Squad A (proactive) or           │                         │       │
│ │         │   Squad B (reactive/incident)      │                         │       │
│ │         └──────────────┬─────────────────────┘                         │       │
│ │                        │                                               │       │
│ │          ┌─────────────┴───────────────┐                               │       │
│ │          v                             v                               │       │
│ │  ┌────────────────────┐  ┌──────────────────────────────────┐          │       │
│ │  │      SQUAD A       │  │            SQUAD B               │          │       │
│ │  │  (SequentialAgent) │  │   (SequentialAgent pipeline)     │          │       │
│ │  │                    │  │                                  │          │       │
│ │  │ > Architect        │  │ Phase 1: Acknowledge             │          │       │
│ │  │ > Simulator        │  │ Phase 2: Triage <- ParallelAgent │          │       │
│ │  │ > Watchdog         │  │   ├── Investigator               │          │       │
│ │  │ > Tuner            │  │   ├── Dependency Analyst         │          │       │
│ │  └────────────────────┘  │   ├── Security Analyst           │          │       │
│ │                          │   └── Logs Analyst               │          │       │
│ │                          │ Phase 3: RCA (synthesis)         │          │       │
│ │                          │ Phase 4: Operator (CONFIRM) +    │          │       │
│ │                          │          Comms Officer           │          │       │
│ │                          │ Phase 5: Scribe -> Postmortem    │          │       │
│ │                          └──────────────────────────────────┘          │       │
│ └────────────────────────────────────────────────────────────────────────┘       │
│                                                                                  │
│ OBSERVABILITY LAYER (Cross-cutting - all layers active simultaneously)           │
│ ┌──────────────────────────────────────────────────────────────────────────┐     │
│ │ ADK Web UI     -> Real-time trace tree, session state, YAML event stream │     │
│ │ OTel Spans     -> Cloud Trace & Langfuse (execution trees, token counts) │     │
│ │ Structured Logs-> Cloud Logging (JSON, duration_ms, status per tool)     │     │
│ │ Custom Metrics -> Cloud Monitoring (duration, call counts, error rates)  │     │
│ └──────────────────────────────────────────────────────────────────────────┘     │
└──────────────────────────────────────────────────────────────────────────────────┘
Agent State Machine & Execution Flow
Key Architectural Decisions
| Decision | Rationale |
|---|---|
| Sequential Pipelines | Guarantees phase ordering in incident response — triage must complete before remediation begins |
| Parallel Triage | Investigator, Security, Dependency, and Logs agents run simultaneously, drastically reducing MTTR |
| Session State Handoffs | Agents share data via decoupled session.state rather than direct API calls — high fault tolerance |
| CONFIRM Safety Gate | Hard lock on the Operator agent — no infrastructure mutation without explicit human approval |
| Asynchronous Telemetry | Metric exporters run in background queues to prevent observability overhead from delaying agent response |
| OTLP for Langfuse | Reuses ADK's existing OpenTelemetry provider — zero additional instrumentation on the agent code |
Agent Design
Squad A - Proactive Platform Engineers
Handles proactive optimization, new service onboarding, alert tuning, and system health checks.
- Architecture Agent — Detects tech stacks from repositories, generates SLO YAML configs, and drafts monitoring infrastructure as code (Terraform)
- Simulator Agent — Backtests new alert configurations against historical telemetry to prevent alert fatigue before rules go live
- Data Health Watchdog — Monitors the monitoring system itself: validates metric ingestion rates, checks API quotas, and pings agent infrastructure health
- Tuner Agent — Analyzes historical alert noise and metric distributions to dynamically recommend P95/P99 threshold adjustments
Squad B - Reactive SRE Responders
Handles reactive P1/P2 incident response via a strict 5-phase SequentialAgent pipeline.
Phase 1: Acknowledge
- Triggers PagerDuty on-call escalation and spins up a dedicated Slack incident channel
Phase 2: Triage (4 agents run in parallel)
- Investigator — Executes PromQL queries and calculates composite service health scores
- Dependency Analyst — Checks external API health and upstream cloud provider status
- Security Analyst — Audits Cloud Armor/WAF rules for active attack patterns
- Logs Analyst — Fetches recent error logs and correlates them with distributed trace IDs
Phase 3: Root Cause Analysis
- The Commander LLM synthesizes all parallel triage output into a root cause hypothesis
Phase 4: Remediation
- Operator — Executes infrastructure fixes (e.g., Kubernetes rollback, WAF rule update) — requires explicit human
CONFIRM - Comms Officer — Updates public status pages and broadcasts internal Slack notifications
Phase 5 Postmortem
- Scribe — Auto-drafts a structured incident timeline and creates follow-up Jira tickets
The CONFIRM Safety Gate
The Operator agent features a hard safety lock. For any mutable infrastructure action (Kubernetes resource changes, WAF rule updates), the system prompt enforces:
- Propose the exact action to be taken with full context
- Halt execution and wait for explicit human
CONFIRMinput in the next message - Execute only upon receiving the
CONFIRMkeyword — never autonomously
This is the most critical production safety pattern in the system. Agents are first responders; humans remain decision-makers.
Infrastructure Stack
The platform is designed to interface with modern cloud-native environments:
| Component | Technology | Role |
|---|---|---|
| Compute & Workloads | Cloud Run, GKE, Compute Engine | Host target services and agent runtime |
| Telemetry Generation | Prometheus + Cloud Logging | Scrapes /metrics endpoints, collects native logs |
| Event Routing | Alertmanager → Pub/Sub | Routes SLO breach alerts to trigger agent workflows |
| Agent Tools | Cloud Run Functions | Serverless HTTP functions called by agents (PromQL, Logs, Health) |
| Secrets | Secret Manager | API keys, tokens — never hardcoded |
| CI/CD | Cloud Build | Auto-deploys agent updates on code push |
Observability Stack (7-Layer)
This platform implements one of the most comprehensive observability patterns available for multi-agent systems. Every action is logged, traced, and scored.
| Layer | Tool | What It Captures |
|---|---|---|
| 1 | ADK Web UI | Real-time trace tree, full prompt/response, session state — best for development |
| 2 | Structured Logs | JSON logs per tool call: duration_ms, status, agent, call_id |
| 3 | Cloud Trace | GCP distributed tracing — deep agent hierarchy + GenAI token counts |
| 4 | Agent Evaluation | Automated scoring against 10 golden scenarios (tool accuracy + keyword coverage) |
| 5 | LangSmith | Tool-level tracing — useful for LangChain/LangGraph team comparisons |
| 6 | Langfuse | OTLP export — cost dashboards, P95 latency, usage capacity planning |
| 7 | Cloud Monitoring | Async custom metrics: tool_calls_total, tool_duration_ms for Grafana |
Example Telemetry Profile
When an agent performs a full system check, the resulting OpenTelemetry span waterfall captures every sub-action:
Span Waterfall (example run):
  invocation                                     ████████████████████ ~50s
    invoke_agent sre_platform [GenAI]            ████████████████████
      call_llm                                   ████████████████████
        generate_content [gemini-2.5-flash]      ████████████
        invoke_agent squad_a_coordinator         ████████████
          invoke_agent watchdog                  ████████
            watchdog.query_internal_metrics      ███  ~7s    ← custom span
            watchdog.alert_platform_team         █    ~1s    ← custom span
            watchdog.check_gcp_quotas            ██   ~11s   ← custom span
            watchdog.ping_agent_runtime          █    ~2ms   ← custom span
All spans appear simultaneously in Cloud Trace and Langfuse via a single OTLP export. The ADK Web UI shows them in real-time during execution.
Agent Evaluation Framework
Testing LLMs requires a shift from unit tests to probabilistic evaluation. This platform includes an automated scoring pipeline.
Scoring Formula
Tool Accuracy   = (expected tools called) / (total expected tools)
Keyword Coverage = (expected keywords in response) / (total expected keywords)
Overall Score   = (Tool Accuracy + Keyword Coverage) / 2
PASS            = Overall Score ≥ 0.70  (production gate: ≥ 0.90)
What Gets Tested
- Tool Accuracy — Did the agent select the optimal tool set for the scenario?
- Keyword Coverage — Did the final synthesis contain the required technical context?
- Pass/Fail Gates — CI/CD pipelines require ≥90% overall score across 10 golden scenarios (e.g.,
latency_incident,security_incident,resource_saturation) before any prompt update is deployed
Observability Tool Comparison
For enterprise implementations, the observability stack is tailored to the client's ecosystem:
| Client Profile | Recommended Stack |
|---|---|
| Enterprise / GCP-Native | Cloud Trace + Cloud Monitoring + Native Logs |
| Multi-Cloud / Framework-Agnostic | Langfuse (self-hosted or cloud) + custom metrics |
| LangChain / LangGraph Teams | LangSmith native integration |
| Strict Compliance / Data Sovereignty | Langfuse self-hosted within client VPC |
| Small Company / Budget-Conscious | Langfuse cloud free tier + ADK Web UI |
Deployment Architecture
Development (Current)
Agents run locally via adk web, connecting to GCP services (Cloud Trace, Langfuse) over the internet.
Production Target (Cloud Run)
Cloud Run (containerized ADK agent)
  ├── stdout logs     → Cloud Logging (automatic)
  ├── Cloud Logging   → Cloud Monitoring log-based metrics
  ├── OTel spans      → Cloud Trace (native, low latency)
  └── OTel spans      → Langfuse (same OTLP code, zero changes)
Deploying to Cloud Run requires zero code changes — the observability stack auto-upgrades to native Cloud Logging ingestion.
Conceptual Repository Structure
Note: This represents the architectural structure of the implementation. Specific file names and internal logic are proprietary.
Multi-Agent-SRE-Platform/
├── core_engine/
│   ├── agent_router/            ← Root intent classification & routing
│   ├── observability/           ← OTel setup, @observe decorator, async metric queues
│   └── memory_management/       ← Session state and context window handlers
│
├── squads/
│   ├── proactive_squad_a/       ← Architect, Simulator, Watchdog, Tuner
│   └── reactive_squad_b/        ← 5-phase pipeline: Acknowledge → Triage → RCA → Remediate → Postmortem
│
├── integrations/
│   ├── cloud_providers/         ← GCP / AWS API wrappers
│   ├── monitoring_tools/        ← Prometheus, Grafana, Datadog hooks
│   └── communication/           ← Slack, PagerDuty, Jira integration logic
│
├── evaluation/
│   ├── golden_scenarios/        ← JSONL datasets for agent testing (10 scenarios)
│   └── scoring_engine/          ← Automated CI/CD pass/fail logic
│
└── infrastructure_as_code/      ← Terraform modules for deploying the agent framework
Roadmap
- Cross-Incident Memory — Implement Vertex AI RAG Memory so agents correlate a current incident with a similar one resolved months ago
- Multi-Human Approval — Expand the CONFIRM gate to require M-of-N approvals for highly destructive operations
- A/B Prompt Testing — Integrate Langfuse Datasets to scientifically compare prompt strategies against MTTR metrics
- LLM-as-a-Judge — Upgrade evaluation from keyword matching to semantic scoring using a critic LLM
- Domain Extensions — Apply the same architecture to Customer Support, Finance/Compliance, and HR/Onboarding use cases
Consulting & Implementation
An SRE team doesn't scale linearly with incidents. Agents do.
This architecture is available as a blueprint for enterprise implementation. We specialize in designing, building, and safely deploying multi-agent AI systems tailored to your unique infrastructure and operational workflows.
Our Principles:
- Agents as First Responders, Humans as Decision-Makers — Safety gates (CONFIRM loops) are mandatory for all mutable infrastructure actions
- Observability is Non-Negotiable — You cannot trust what you cannot measure; we instrument every token and API call
- Evaluation Gates Deployments — No AI logic reaches production without passing a rigorous, automated evaluation suite
If you're exploring multi-agent automation for your DevOps, SRE, or Platform Engineering teams — feel free to reach out to discuss architecture reviews or custom implementations.
Write to us at: contact@qubitlyventures.com